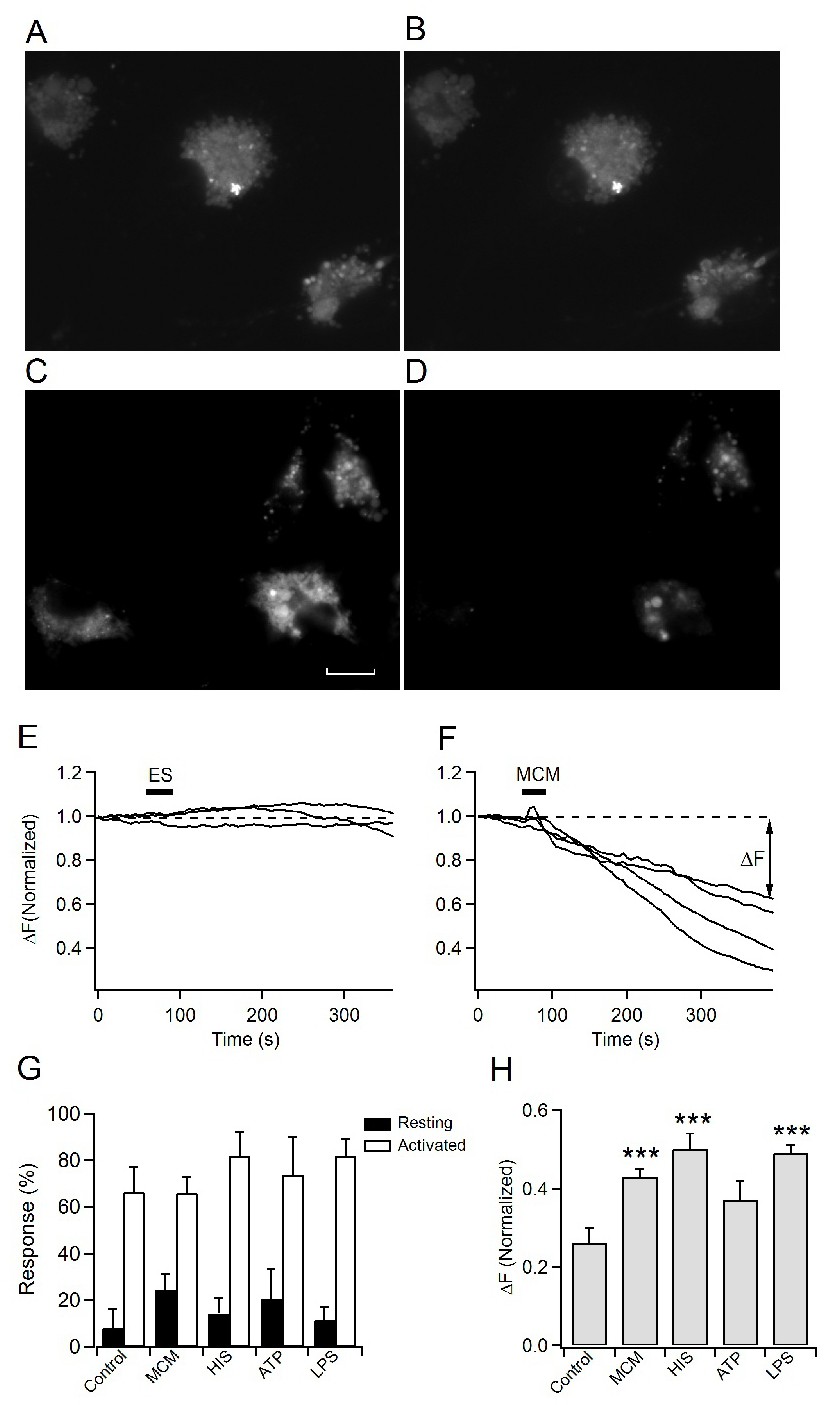
Fig. 4. Changes in fluorescence intensity of quinacrine-loaded cells during exocytosis. A) Example image of quinacrine loaded microglia cells before and B) ~5 min after application of external solution by micro-perfusion (control experiment). C) Example image of quinacrine loaded microglia cells before and D) ~5 min after application of MCM. A larger loss of fluorescence was observed in respect to control. E) Time courses of fluorescence changes (normalized) in control cells and F) MCM treated cells from the upper images. G) Percentage of microglial cells (resting versus activated) that showed a positive exocytotic response (fluorescence decay >5% FINITIAL) following stimulation with MCM, histamine (HIS), ATP, and LPS. H) Amplitude (DF) measured from fluorescence curves (FINITIAL - FFINAL). Data represent average values of at least three independent culturing experiments. ***p<0.001, using the Mann-Whitney Rank Sum test. Scale bar 5 µm.